Trending

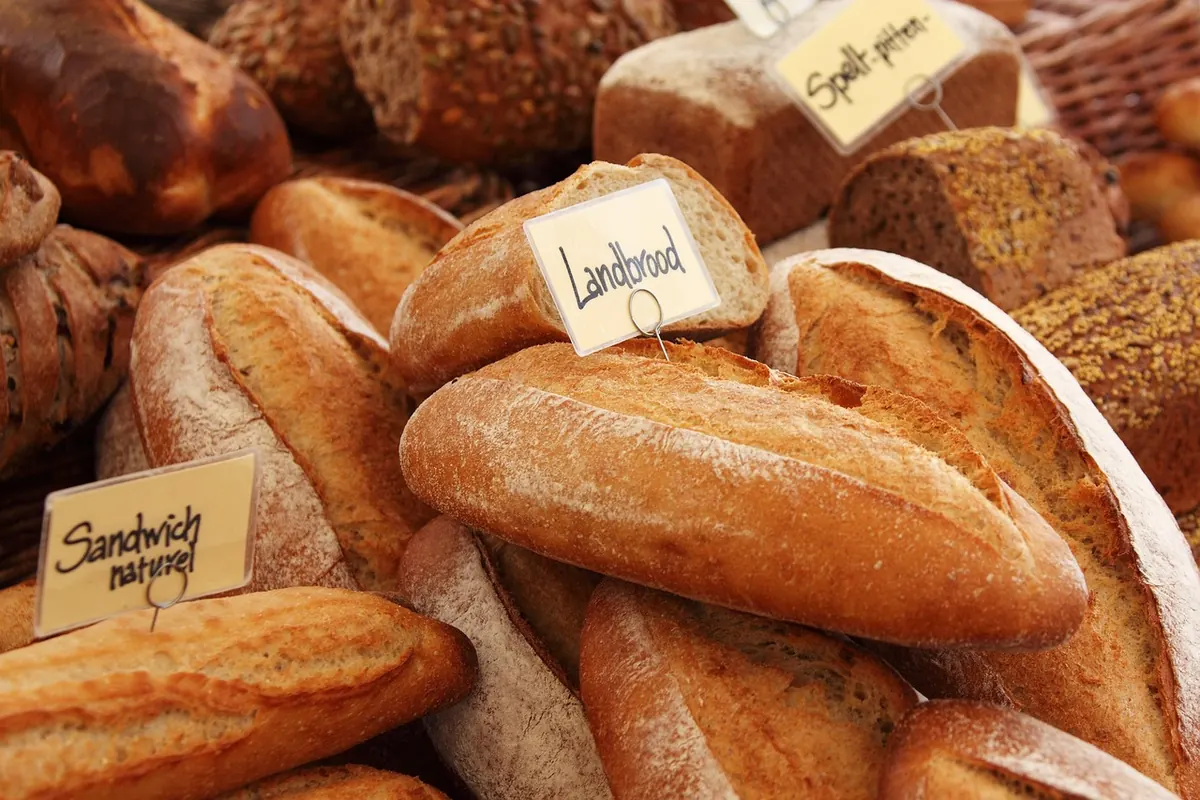
Most bakeries decide tomorrow's production while today's afternoon rush is still winding down. Someone looks at the empty trays, remembers last Tuesday, and writes down a number. That number is usually close enough to keep things running, which is exactly why the problem stays invisible: the loaves that went onto the discount shelf and the customers who walked out because the croissants sold out at nine rarely get mentioned in the same sentence. Closing the gap between "we usually sell about this much" and "we expect to sell about this much tomorrow" is a small, concrete forecasting problem. This account follows one neighborhood bakery with two wholesale accounts and no data team through its first year of relying on a model instead of a hunch.
A bakery's production decision has an awkward cost structure. Short by a dozen loaves and you lose the margin on those sales plus a little goodwill. Over by a dozen and you have already paid for flour, butter, yeast and the hours the baker stood at the bench. The two errors are not equal, and they are not equal in a way that stays constant — a sold-out Saturday costs more in reputation than a sold-out Wednesday.
There is a second problem: one number for the whole shop hides everything. Cinnamon rolls spike on weekend mornings, focaccia follows the lunch trade and the weather, sourdough moves with the wholesale standing orders. A single "we'll bake about the same as last week" decision smooths over patterns a model can hold separately.
Nothing had to be bought. The bakery already produced a daily record of what it sold, what it threw away and what it ran out of:
Two years of history was enough. Ninety days would have been a workable start, though with only a few samples of each weekday the early forecasts wobble more than anyone would like.
Logging stockouts. Without them, a model learns that you sold twelve focaccia on a sunny Friday because twelve was all you had.
Before anything else, the bakery built a baseline: for each item, take the median of the last eight same weekdays. If a model cannot beat that, it does not deserve to run.
The first working version was a gradient boosted tree on plain tabular data — the kind of model that trains in seconds on a laptop and needs no special hardware. Lagged sales (yesterday, same day last week), calendar flags, the weather forecast and a count of wholesale orders went in as columns. One model per item, not one model for the shop.
A linear regression with day-of-week dummies would also have been reasonable, and it is worth trying first if you want to see which inputs matter. Trees handle the interactions — a rainy Saturday behaving differently from a rainy Tuesday — without hand-tuning, which keeps the maintenance burden low.
Steps one to six took a couple of weekends. Step seven decides whether anyone uses it.
Mean absolute error — average loaves off per item per day — is a useful training metric and a poor business one, because it treats a wasted loaf and a missed sale as identical. The bakery weighted the errors instead: a missed sale counted as the lost margin, a wasted loaf counted as its full cost. The sheet was then judged on how often it landed within a tray either way.
Two other numbers belonged on the Monday review: how often the baker overrode the suggestion, and whether those overrides turned out to be right. Overrides are not failures. They are a signal that the model is missing something, and a month of logged overrides usually tells you what.
Treat the figures in this account as an illustration of the process, not a benchmark. Every shop's product mix, footfall and tolerance for waste is different.
The first month was confidently wrong on public holidays, because the model had seen only a few of them. A new café account shifted the sourdough baseline overnight, and the model needed several weeks to catch up. A heatwave moved everything an hour earlier and changed what people wanted.
The fixes were unglamorous. Holiday and event flags were added by hand. The model was refit weekly, which is cheap at this data size. Floors and ceilings kept the bake number inside a range the baker trusted. Most importantly, the sheet stayed advisory: someone who has worked the counter for six years knows things the columns do not.
Pick the item that causes the most grief — the one you are forever discounting or forever running out of. Build the baseline. Add a model only if it clearly beats that baseline on held-out days. Run it alongside your normal judgement for a month and compare.
Keep the machinery plain: a script, a spreadsheet, a printed sheet. Log what you throw away and what you run out of, because those two columns are the whole point. And let the person at the bench make the final call — a forecast nobody trusts is just another printout.